Introduction
Antibiotic resistance is defined as the ability of a microorganism to survive despite appropriate antibiotic therapy [1]. It is considered an imminent threat to human health by the World Health Organization (WHO) because of its associated mortality and the economic burden it imposes on healthcare systems [1]. Reports from the Centers for Disease Control and Prevention (CDC) estimate that more than two million infections caused by antimicrobial-resistant pathogens occur annually in the United States, resulting in approximately 29,000 deaths per year and healthcare costs approaching five billion US dollars. In Europe, more than 33,000 deaths and 874,000 cases of disability are attributed each year to antimicrobial resistance, representing an estimated healthcare cost of 1.5 billion US dollars [1]. Sub-Saharan Africa bears the highest mortality rate worldwide related to antimicrobial resistance, with 99 deaths per 100,000 population [2].
To address this growing threat, the WHO has established regional surveillance systems for the emergence of priority antibiotic-resistant bacterial strains through the use of the WHONET application [3]. In the Democratic Republic of the Congo, this surveillance system has been implemented by the WHO since September 2022, with a particular focus on antimicrobial resistance monitoring [2]. However, this surveillance remains largely general and does not specifically address the unique epidemiological characteristics of closed care settings such as intensive care units. Indeed, ICUs have limited interaction with the external environment, which partly explains the predominance of human-associated pathogens compared with environmental organisms in these settings [4].
In low-income countries, the mortality associated with healthcare-associated infections in intensive care units is considerably higher (33.6%) than in high-income countries, where it is generally below 20% [5]. Multidrug-resistant Gram-negative bacteria, particularly Acinetobacter baumannii, Pseudomonas aeruginosa, and Klebsiella pneumoniae, play a major role in this excess mortality observed in ICUs in resource-limited settings [5].
As in most low-income countries, patients treated in the intensive care units that have developed in the city of Kinshasa, Democratic Republic of the Congo, are exposed to the consequences of largely empirical and non-targeted antibiotic therapy. The scarcity of published studies on local antibiotic resistance patterns and the difficulty in performing bacteriological analyses due to limited logistical and financial resources constitute major challenges. Yet, antibiotic therapy remains the cornerstone of sepsis management.
To reduce mortality related to antibiotic resistance and to limit the emergence of increasingly resistant bacterial strains, empirical antibiotic therapy must be appropriate and guided by knowledge of the local bacterial ecology within each ICU [6]. In this context, and in order to contribute to improving antibiotic prescribing practices in intensive care units across Kinshasa, we considered it essential to conduct the present study. The primary objective was to determine the bacterial antibiotic resistance profile in intensive care units in the city of Kinshasa and to assess the impact of this resistance on patient survival.
Methods
Study design, period, and setting
This was a prospective, observational, multicenter study conducted from May 1 to October 31, 2024. The study took place in seven intensive care units (ICUs) in Kinshasa, Democratic Republic of the Congo, including both public and private institutions with fully operational 24-hour ICU services that agreed to participate. The participating centers were: Ngaliema Clinic, Kinshasa Provincial General Referral Hospital, Médecins de Nuit Clinic, Monkole Mother and Child Hospital Center, University Clinics of Kinshasa, Sino-Congolese Friendship Hospital, and Biamba Marie Mutombo Hospital. All bacteriological analyses were performed at the Bacteriology and Research Department of the National Institute for Biomedical Research (NIBR), Kinshasa.
Patient selection
Inclusion criteria
Patients were included if they had been admitted to the ICU for a minimum of 48 hours and met the sepsis criteria of the 2016 consensus. To rapidly identify high-risk individuals, the quick Sequential Organ Failure Assessment (qSOFA) score was applied upon ICU admission.
Exclusion criteria
Exclusion criteria were applied to ensure patient safety and data reliability. These included immunocompromised patients, including people living with HIV, and those receiving long-term corticosteroids or other immunosuppressive therapies. Neutropenic patients, those with hematological malignancies or metastatic cancer, patients with bone marrow aplasia, individuals undergoing chemotherapy or radiotherapy, and transplant recipients were excluded. Blood culture samples that failed to meet laboratory quality standards, as well as positive cultures deemed contaminants, were not included in the analysis.
Data collection process
A standardized data collection form was used to record all study variables and was completed progressively throughout the study. Each ICU and patient were coded anonymously, following a dedicated procedural document.
Training sessions were organized by the NIBR research team for all ICU staff involved. Each ICU staff received one full day of training covering blood culture collection, sample preservation, and transport procedures, including theoretical sessions and simulation exercises. A standardized protocol and reference guide were provided to all participating ICUs.
Sample collection, preservation, transport, and analysis
Blood culture collection followed strict protocols to avoid contamination. In adults, two samples of 10 mL of blood were collected into aerobic BACT/ALERT bottles (bioMérieux); in children (≤15 years), 1-4 mL were collected into pediatric BACT/ALERT bottles. Inoculated bottles were stored at room temperature, protected from light, for no more than two hours before transport to the NIBR laboratory. Insulated containers and dedicated personnel ensured prompt transport despite traffic constraints.
Laboratory analysis included biochemical identification using the Leminor minimal gallery system. Coagulase-negative Staphylococcus (CoNS) isolates were considered contaminants; other bacteria were classified as pathogenic. Antimicrobial susceptibility testing was performed using disk diffusion, following CLSI recommendations. Quality control was ensured using ATCC reference strains and oversight by a medical biologist and laboratory technician.
Variables
All outcomes, exposures, predictors, potential confounders, and effect modifiers were clearly defined. Sepsis diagnosis, pathogen identification, and antibiotic susceptibility were assessed according to standard criteria. Patient demographics, comorbidities, prior antibiotic use, and ICU length of stay were recorded to account for confounding factors.
Bias
Potential sources of bias were minimized by applying strict inclusion and exclusion criteria consistently across all ICUs. Data collection was standardized, staff were trained in sample handling, and all laboratory analyses were centralized at NIBR following uniform protocols. Patient characteristics, comorbidities, prior antibiotic use, and sepsis severity were recorded to account for confounding, while quality control measures ensured accuracy and reliability of results.
Study size
The study included all eligible patients admitted to participating ICUs during the study period. No formal sample size calculation was performed, but efforts were made to maximize inclusion by involving multiple centers and recruiting over six months.
Statistical analysis
Data were collected using REDCap and analyzed with Stata version 18.0. Quantitative variables were summarized as means ± standard deviations, and categorical variables as frequencies and percentages. Proportions were compared using Pearson’s chi-square or Fisher’s exact test, as appropriate. Survival analyses were performed using Kaplan–Meier curves and the Wilcoxon test. Factors associated with outcomes were assessed using Cox proportional hazards regression, adjusting for potential confounders. Missing data were handled using available-case analysis, and sensitivity analyses were conducted to evaluate the robustness of findings. A p-value <0.05 was considered statistically significant.
Ethical considerations
Authorization was obtained from administrators of all participating hospitals. The study protocol was approved by the Scientific Committee of the Department of Anesthesiology and Intensive Care of the University Clinics of Kinshasa and by the Ethics Committee of the School of Public Health (reference ESP/CE/24/2025). Informed consent was obtained from patients or legal representatives. Blood culture results were communicated promptly to clinical teams for therapeutic adjustment. The study adhered to the Declaration of Helsinki, and no conflicts of interest were declared.
Results
3.1. Flow diagram of patients and blood cultures
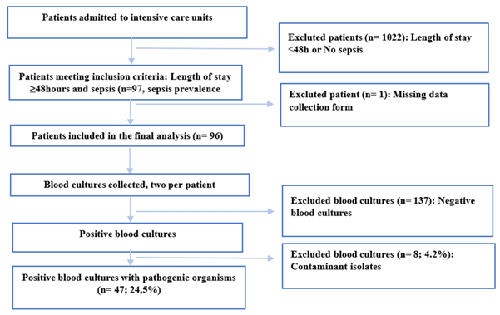
During the study period, 1,119 patients were admitted to the participating ICUs. Among them, 97 patients met the inclusion criteria (ICU stay ≥48 hours and presence of sepsis), corresponding to a sepsis prevalence of 8.7%. After exclusion of one patient due to missing data, a total of 96 patients were finally included in the analysis.
Each patient underwent two blood culture samplings, resulting in a total of 192 blood cultures. Of these, 137 were negative and 8 (4.2%) were considered contaminants. Ultimately, 47 blood cultures yielded pathogenic organisms and were analyzed, corresponding to an overall positivity rate of 24.5% (Figure 1).
3.2. Sociodemographic characteristics of patients
The sociodemographic characteristics of the patients are presented in Table 1.
The majority of patients were aged between 18 and 59 years (54.5%), while elderly patients (≥60 years) accounted for 37.5%. The median age was 51.5 years (interquartile range: 29–68). Females slightly predominated, with a sex ratio of 0.96. Most patients were referred from another intra-hospital department (54.2%), 34.4% were transferred from another healthcare facility, and 11.4% were admitted directly from home.
| Variables | Frequency n=96 | % |
| Age group(years) | ||
| < 18 | 8 | 8.3 |
| 18 à 59 | 52 | 54.5 |
| ≥ 60 | 36 | 37.5 |
| Median age (IQR) | 51.5 | |
| Sex | ||
| Male | 47 | 49 |
| Female | 49 | 51 |
| Patient origin | ||
| Other intra-hospital ward | 52 | 54.2 |
| Other healthcare facility | 33 | 34.4 |
| Home | 11 | 11.4 |
Legend : IQR= interquartile range
3.3. Clinical characteristics of patients
Clinical characteristics are summarized in Table 2.
According to sepsis criteria, 70.8% of patients had a Glasgow Coma Scale score <15, 94.8% had a respiratory rate ≥22 breaths per minute, and 43.7% had a systolic blood pressure ≤100 mmHg. Body temperature was ≥38.2°C in 44.8% of patients. More than half of the patients (57.3%) had received antibiotics in the two weeks preceding ICU admission.
The suspected source of infection was predominantly pulmonary (59.4%), followed by urinary (25%), abdominal (22.9%), and cutaneous sources (17.7%). All patients were receiving antibiotic therapy at the time of inclusion. Beta-lactams were the most commonly used antibiotics (97.9%), followed by nitroimidazoles (25%), aminoglycosides (22.9%), and oxazolidinones (linezolid) (15.6%).
The most frequent comorbidities were arterial hypertension (43.8%) and diabetes mellitus (18.7%). Invasive devices included urinary catheters (96.9%), endotracheal tubes (39.6%), and central venous catheters (16.7%).
| Variables | Frequency n=96 | % |
| Glasgow Coma Scale | ||
| < 15 | 68 | 70.83 |
| 15 | 28 | 29.17 |
| Respiratory raye | ||
| ≥ 22 breaths/minute | 91 | 94.8 |
| < 22 breaths/minute | 5 | 5.2 |
| Systolicblood pressure | ||
| > 100mmHg | 54 | 56.3 |
| ≤ 100mmHg | 42 | 43.7 |
| Body temperature | ||
| < 38.2 ° C | 53 | 55.2 |
| ≥ 38.2 ° C | 43 | 44.8 |
| Antibiotic use within the previous two weeks | 55 | 57.3 |
| Suspected source of infection | ||
| Pulmonary | 57 | 59.4 |
| Urinary | 24 | 25 |
| Abdominal | 22 | 22.9 |
| Cutaneous | 17 | 17.7 |
| Other | 14 | 14.6 |
| Ongoingantibiotictherapy | 96 | 100 |
| Antibiotic class | ||
| Beta-lactams | 94 | 97.9 |
| Nitrofurans and nitroimidazoles | 24 | 25 |
| Aminoglycosides | 22 | 22.9 |
| Oxazolidinones | 15 | 15.6 |
| Macrolides | 8 | 8.3 |
| Quinolones | 6 | 6.2 |
| Glycopeptides | 3 | 3.1 |
| Other | 6 | 6.2 |
| Comorbidities | ||
| Hypertension | 42 | 43.8 |
| Diabetes mellitus | 18 | 18.7 |
| Chronic kidney disease | 8 | 8.3 |
| Obesity | 6 | 6.2 |
| Alcohol consumption | 2 | 2.1 |
| Tobacco use | 2 | 2.1 |
| Invasive devices | ||
| Urinary catheter | 93 | 96.9 |
| Endotracheal tube | 38 | 39.6 |
| Central venous catheter | 16 | 16.7 |
3.4. Pathogens identified by blood culture
The distribution of pathogens identified in blood cultures is presented in Table 3.
Both the first and second blood cultures showed similar pathogen profiles and comparable proportions. Among the 26 isolates identified from the first blood cultures, Escherichia coli was the most frequent pathogen (42.3%), followed by Klebsiella pneumoniae (26.9%). Pseudomonas aeruginosa, Acinetobacter baumannii, and Staphylococcus aureus each accounted for 7.7%, while Salmonella spp. and Enterococcus spp. represented 3.8% each.
The second blood cultures identified Escherichia coli in 35.7% of cases and Klebsiella pneumoniae in 25%, with similar proportions for the remaining pathogens.
Overall, considering all blood cultures, Escherichia coli accounted for 38.9% of isolates, followed by Klebsiella pneumoniae (25.9%), Pseudomonas aeruginosa, Acinetobacter baumannii, and Staphylococcus aureus (7.4% each), and finally Salmonella spp. and Enterococcus spp. (3.7% each).
| Identified organism | Blood culture | |||||
| First blood culture | Second blood culture | Overall | ||||
| Frequency(n=26) | (%) | Frequency(n=28) | (%) | Frequency(n=54) | (%) | |
| Klebsiella Pneumoniae | 7 | 26.9 | 7 | 25.0 | 14 | 25.9 |
| Escherichia Coli | 11 | 42.3 | 10 | 35.7 | 21 | 38.9 |
| Salmonella spp | 1 | 3.8 | 1 | 3.6 | 2 | 3.7 |
| Pseudomonas aeruginosa | 2 | 7.7 | 2 | 7.1 | 4 | 7.4 |
| Staphylococcus aureus | 2 | 7.7 | 2 | 7.1 | 4 | 7.4 |
| Acinetobacter baumannii | 2 | 7.7 | 2 | 7.1 | 4 | 7.4 |
| Enterococcus | 1 | 3.8 | 1 | 3.6 | 2 | 3.7 |
| Candida sp | 0 | 0.0 | 3 | 11.5 | 3 | 5.6 |
3.5. Antimicrobial susceptibility and resistance patterns
Antimicrobial resistance profiles of the isolated pathogens are shown in Table 4. Candida spp. isolates were excluded from the analysis of bacterial resistance.
In descending order, resistance rates to the tested antibiotics were as follows: ampicillin (94.6%), ceftriaxone (89.2%), cotrimoxazole (72.7%), doxycycline (71.4%), piperacillin–tazobactam (65.1%), ciprofloxacin (61.7%), gentamicin (51.1%), ceftazidime (50%), chloramphenicol (43.2%), levofloxacin (25%), erythromycin (25%), clindamycin (14.3%), cefoxitin (12.5%), amikacin (8.9%), and meropenem (7.8%). Susceptibility rates showed the inverse trend.
Among the 35 Enterobacterales isolates, 19 (54.3%) were ESBL producers. All four Staphylococcus aureus isolates were methicillin-resistant (MRSA).
| Antibiotic | Susceptible n (%) | Resistant n (%) |
| Ampicillin | 2 (5.4) | 35 (94.6) |
| Ceftriaxone | 4 (10.8) | 33 (89.2) |
| Ceftazidime | 2 (50.0) | 2 (50.0) |
| Amikacin | 41 (91.1) | 4 (8.9) |
| Gentamicin | 22 (48.9) | 23 (51.1) |
| Trimethoprim–sulfamethoxazole | 12 (27.3) | 32 (72.7) |
| Chloramphenicol | 25 (56.8) | 19 (43.2) |
| Ciprofloxacin | 18 (38.3) | 29 (61.7) |
| Levofloxacin | 6 (75.0) | 2 (25.0) |
| Erythromycin | 6 (75.0) | 2 (25.0) |
| Clindamycin | 6 (85.7) | 1 (14.3) |
| Piperacillin–tazobactam | 15 (34.9) | 28 (65.1) |
| Cefoxitin | 7 (87.5) | 1 (12.5) |
| Meropenem | 47 (92.2) | 4 (7.8) |
| Doxycycline | 2 (28.6) | 5 (71.4) |
| Other antibiotics* | 30 (73.2) | 11 (26.8) |
| Enzyme production | n | (%) |
| ESBL positive (n=35) | 19 | 54.3 |
| MRSA positive (n=4) | 4 | 100 |
Legend: ESBL = extended-spectrum beta-lactamase; MRSA = methicillin-resistant Staphylococcus aureus; *Other antibiotics include penicillin and azithromycin.
Candida spp. isolates were excluded from the antimicrobial resistance analysis.
3.6. Specific resistance profiles of Escherichia coli and Klebsiella pneumoniae
The specific antimicrobial resistance patterns of Klebsiella pneumoniae and Escherichia coli are presented in Table 5.
Klebsiella pneumoniae showed the highest resistance to ampicillin (100%), ceftriaxone (85.7%), piperacillin–tazobactam (85.7%), cotrimoxazole (85.7%), and ciprofloxacin (71.4%). Lower resistance rates were observed for gentamicin (57.1%), chloramphenicol (57.1%), amikacin (14.3%), and none of the isolates were resistant to meropenem.
Escherichia coli demonstrated resistance rates of 100% to ampicillin and ceftriaxone, 84.2% to cotrimoxazole, 75% to ciprofloxacin, 70.6% to piperacillin–tazobactam, 35% to gentamicin, 30% to chloramphenicol, 10% to meropenem, and 0% to amikacin.
| Blood cultures | ||||||
| First | Second | Overall | ||||
| n | (%) | n | (%) | n | (%) | |
| Klebsiella Pneumoniae | (n=7) | (n=7) | (n=14) | |||
| Antibioticresistance | ||||||
| Ampicillin | 7 | 100 | 7 | 100 | 14 | 100 |
| Ceftriaxone | 6 | 85.7 | 6 | 85.7 | 12 | 85.7 |
| Trimethoprim–sulfamethoxazole | 6 | 85.7 | 6 | 85.7 | 12 | 85.7 |
| Ciprofloxacin | 5 | 71.4 | 5 | 71.4 | 10 | 71.4 |
| Gentamicin | 4 | 57.1 | 4 | 57.1 | 8 | 57.1 |
| Chloramphénicol | 4 | 57.1 | 4 | 57.1 | 8 | 57.1 |
| Pipéracillin + Tazobactam | 6 | 85.7 | 6 | 85.7 | 12 | 85.7 |
| Amikacin | 1 | 14.3 | 1 | 14.3 | 2 | 14.3 |
| Meropeneme | 0 | 0.0 | 0 | 0.0 | 0 | 0.0 |
| E. Coli | (n=11) | (n=10) | (n=21) | |||
| Antibioticresistance | ||||||
| Ampicillin | 10 | 100 | 9 | 100 | 19 | 100 |
| Ceftriaxone | 10 | 100 | 9 | 100 | 19 | 100 |
| Trimethoprim–sulfamethoxazole | 9 | 90 | 7 | 77.8 | 16 | 84.2 |
| Ciprofloxacin | 8 | 80 | 7 | 70.0 | 15 | 75 |
| Gentamicin | 4 | 40 | 3 | 30.0 | 7 | 35 |
| Chloramphenicol | 3 | 30 | 3 | 30.0 | 6 | 30 |
| Piperacilline + Tazobactam (n=17) | 7 | 77.8 | 5 | 62.5 | 12 | 70.6 |
| Meropeneme (n=20) | 1 | 10.0 | 1 | 10.0 | 2 | 10.0 |
| Amikacin | 0 | 0.0 | 0 | 0.0 | 0 | 0.0 |
3.7. Impact of prior antibiotic use on blood culture positivity and resistance
Among samples collected from patients who had not received antibiotics in the two weeks preceding ICU admission (n = 85), 27 samples were positive (31.8%). In contrast, among samples from patients who had received antibiotics during the preceding two weeks (n = 107), 20 were positive (18.7%). Blood culture positivity was significantly higher among patients without prior antibiotic exposure (p = 0.036).
Although not statistically significant (p = 0.340), an unexpected trend was observed: the proportion of patients with antibiotic-resistant isolates was higher among those who had not received antibiotics in the preceding two weeks (82.8%) compared with those who had (71.4%).
| Blood culture | P value | ||
| Negative | Positive | ||
| n (%) | n (%) | ||
| Antibiotic use in the previous two weeks | |||
| No | 58 (68.2) | 27 (31.8) | |
| Yes | 87 (81.3) | 20(18.7) | 0.036 |
| Total | 145 (75.5) | 47(24.5) | |
| Antibiotic resistance | |||
| No | Yes | P value | |
| n (%) | n (%) | ||
| Antibiotic use in the previous two weeks | |||
| No | 5 (17.2) | 24 (82.8) | |
| Yes | 6 (28.6) | 15(71.4) | 0.340 |
| Total | 11 (22.0) | 39(78.0) |
3.8. Survival analysis and factors associated with mortality
3.8.1. Kaplan–Meier survival curves according to antibiotic resistance and ESBL profile
At ICU admission, patients infected with antibiotic-resistant bacteria and those infected with susceptible bacteria had the same probability of survival (100%). From day 2 onward, survival declined more rapidly among patients infected with resistant bacteria, indicating earlier mortality in this group.
By day 6, more than half of patients infected with antibiotic-resistant bacteria had died, whereas this threshold was reached only after day 12 among patients infected with susceptible bacteria. At the end of the observation period, survival probability was approximately 25% in the susceptible group and close to 10% in the resistant group (Figure 2).
These Kaplan–Meier curves strongly suggest that antibiotic resistance is associated with significantly reduced survival among ICU patients.
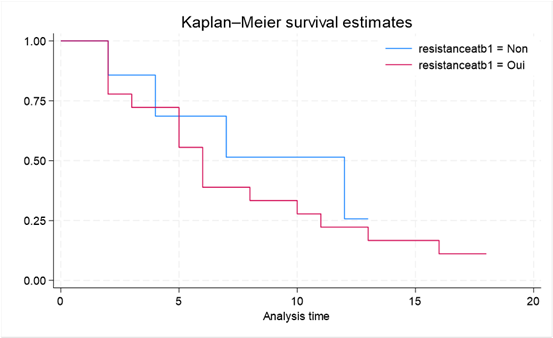
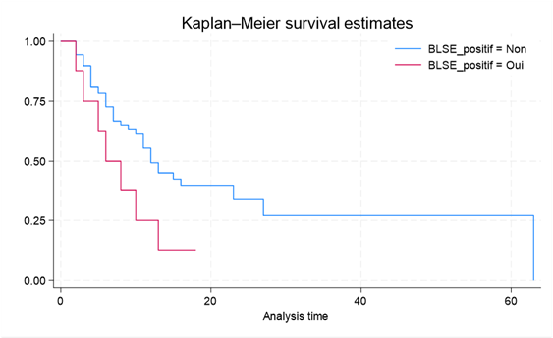
Figure 3 illustrates survival according to ESBL profile. Patients infected with ESBL-producing bacteria had a median survival of 6 days, compared with 12 days among patients infected with non-ESBL-producing bacteria. Seventy-five percent survival was limited to 10 days in the ESBL-positive group, whereas it extended to 63 days in the ESBL-negative group. Mortality incidence was higher in the ESBL-positive group (0.108) than in the ESBL-negative group (0.047).
Among the 35 Enterobacterales isolates, 19 (54.3%) were ESBL producers, corresponding to 8 patients, of whom 7 died, yielding a mortality rate of 87.5%.
3.8.2. Factors associated with mortality: univariate and multivariate Cox regression
Factors associated with mortality are presented in Table 7.
After adjustment for confounding variables, antibiotic resistance was significantly associated with an increased risk of death, with an approximately fivefold higher risk (adjusted HR = 4.94; 95% CI: 1.16–20.96; p = 0.030). Interestingly, arterial hypertension was associated with a lower risk of death (adjusted HR = 0.20; p = 0.037).
There was a non-significant trend toward increased mortality among male patients (adjusted HR = 2.93; p = 0.070) and among patients with impaired consciousness (adjusted HR = 4.31; p = 0.064). Other variables, including age, diabetes mellitus, chronic kidney disease, temperature, and systolic blood pressure, were not significantly associated with mortality in the adjusted model.
| Variable | Crude Hazard Ratio(95% CI) | P value | Adjusted Hazard Ratio (95% CI) | P value |
| Antibiotic resistance (Yes vs No) | 1.41 (0.46 - 4.28) | 0.539 | 4.94 (1.16 - 20.96) | 0.030* |
| Age (per year) | 0.99 (0.97 - 1.01) | 0.066 | 1.01 (0.98 - 1.05) | 0.460 |
| sex (Male vs Female) | 0.82 (0.46 - 1.45) | 0.499 | 2.93 (0.92 - 9.39) | 0.070 |
| Hypertension (Yes vs No) | 0.71 (0.40 - 1.27) | 0.248 | 0.20 (0.04 - 0.91) | 0.037* |
| Diabetes Mellitus (Yes vs No) | 0.49 (0.21 – 1.17) | 0.108 | 0.43 (0.09 – 1.91) | 0.270 |
| Glasgow Coma Scale (15 vs < 15) | 1.85 (0.78- 4.37) | 0.162 | 4.31 (0.92 – 20.19) | 0.064 |
| Body temperature (< 38.2 vs ≥ 38.2) | 1.51 (0.85 – 2.66) | 0.159 | 1.72 (0.52 – 5.63) | 0.374 |
| Systolic blood pressure (> 100 mm Hg vs ≤ 100 mm Hg) | 1.48 (0.83 – 2.66) | 0.184 | 2.16 (0.71 – 6.57) | 0.175 |
| Chronic kidney disease (Yes vs No) | 0.95 (0.34 – 2.66) | 0.926 | 1.30 (0.23 - 7.18) | 0.767 |
* Statistically significant (p < 0.05)
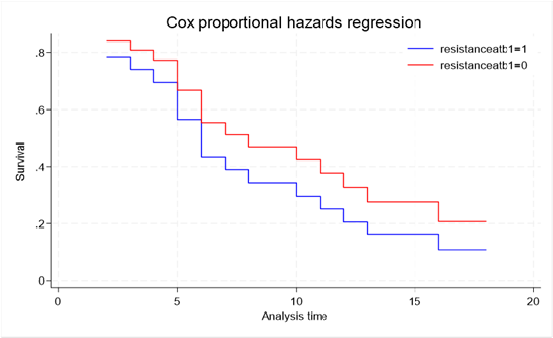
3.8.3. Cox regression survival analysis
Cox regression analysis confirmed that antibiotic resistance was significantly associated with an increased risk of death (HR = 4.94, p = 0.030). As illustrated in Figure 4, patients infected with antibiotic-resistant bacteria consistently exhibited a markedly lower probability of survival throughout the observation period compared with patients infected with susceptible bacteria. After 17 days of follow-up, survival probability was approximately 10% in the resistant group compared with 20% in the susceptible group.
Discussion
The primary objective of this study was to determine the antibiotic resistance profile in intensive care units in Kinshasa. A total of 192 blood culture samples were collected from 96 patients, of which 47 were positive for at least one pathogenic bacterium, corresponding to a positivity rate of 24.5%. Eight samples (4.2%) yielded contaminants, mainly coagulase-negative staphylococci and Bacillus species. Escherichia coli and Klebsiella pneumoniae were the predominant pathogens, exhibiting resistance to nearly all antibiotics tested. The presence of antibiotic resistance was associated with increased mortality and reduced survival over time.
The observed contamination rate (4.2%), largely attributable to skin commensal flora, was lower than the 15.4% reported in Gabon [7] and 40.1% reported in England [8]. This difference may be explained by sampling methods: the Gabonese study mainly collected samples via central venous catheters, while our study relied on peripheral venipuncture. In the Democratic Republic of the Congo, Bieke et al.[9] reported contamination rates of 9.2% (2007–2017) and 7.17% (2015–2017) in Salmonella Typhi surveillance, likely influenced by decentralized collection and analysis. In contrast, our collaboration with a reference laboratory contributed to the low contamination rate and supports the reliability of our findings.
Blood culture positivity was higher among patients not receiving antibiotics in the preceding two weeks. Bitegue et al.[7] observed a similar prevalence of 23% in Gabon, whereas a Moroccan study (2002–2005) reported 45.5% [16], attributed to frequent catheter use and high septicemia incidence (26%) [16]. ICU patients are particularly exposed to healthcare-associated infections due to multidrug-resistant ESKAPE pathogens [1,5]. In low-income countries, Gram-negative bacteria predominate, contrasting with Western Europe, where Gram-positive organisms are more common [5]. Moroccan [16] and Tunisian [18] studies report roughly equal distributions, while French [19] and U.S. [20] studies show predominance of Gram-positive isolates.
In our study, Gram-negative bacteria clearly predominated, with E. coli (38.9%) and K. pneumoniae (25.9%) as the most frequent isolates, consistent with previous Kinshasa [15], Gabon [7], and Dakar [17] studies. Staphylococcus aureus accounted for only 7.4% of isolates, lower than in Morocco [16] and France [19], likely reflecting better infection prevention, antimicrobial stewardship, and hand hygiene compliance [16].
Phenotypic resistance profiles of ESKAPE pathogens showed high multidrug resistance, similar to Mediterranean countries, while Northern Europe exhibits lower resistance [5]. Ceftriaxone resistance, a marker for ESBL production [10], was consistent with GLASS reports, with E. coli and K. pneumoniae showing high resistance to third-generation cephalosporins and fluoroquinolones [11-14]. ESBL-producing E. coli prevalence was 54.3%, similar to Gabon [7] and higher than European and North American studies [20,22]. K. pneumoniae exhibited 85.7% resistance to ceftriaxone and 71.4% to ciprofloxacin; E. coli 100% and 75%, respectively. Carbapenem resistance was observed in two Acinetobacter baumannii isolates, while all S. aureus isolates were methicillin-resistant.
Median survival was 6 days for patients infected with antibiotic-resistant bacteria versus 12 days for those infected with susceptible strains, with an 87.5% mortality rate among ESBL-infected patients, highlighting the severe impact of resistance on ICU outcomes.
Strengths and Limitations
This study has certain limitations. The relatively small sample size may have influenced statistical power and the generalizability of the findings. Despite this, the study provides valuable data on the antimicrobial resistance profiles of pathogenic bacteria causing high mortality in ICUs. The prospective design helped minimize bias and allowed robust, reliable data collection. Close collaboration with the National Institute of Biomedical Research (NIBR), a reference laboratory, further strengthens the credibility of the microbiological results. Overall, the study offers a clear overview of the predominant pathogenic bacteria in Kinshasa ICUs and their resistance patterns. Future large-scale studies are needed to confirm these results and strengthen the evidence base.
Conclusion
This multicenter prospective study highlights a high prevalence of bacterial resistance in seven ICUs in Kinshasa, predominantly involving Enterobacterales, particularly E. coli and K. pneumoniae. These pathogens exhibited marked resistance to first-line antibiotics, notably third-generation cephalosporins and fluoroquinolones, with a substantial proportion of ESBL-producing strains. Antimicrobial resistance was associated with reduced survival and was an independent predictor of ICU mortality. These findings emphasize the urgent need to strengthen local microbiological surveillance to guide empiric antibiotic therapy tailored to the epidemiology of ICUs in Kinshasa. Larger multicenter studies, incorporating environmental and molecular analyses, are warranted to clarify nosocomial transmission dynamics and support effective infection prevention and antimicrobial stewardship strategies.
Declarations
Funding Statement
This study received no specific funding from any public, commercial, or not-for-profit organization.
Competing interests
The authors declare no competing interests.
Author contributions
DM and WM conceived and designed the study. DM contributed substantially to the acquisition, analysis, and interpretation of data. OL supervised the study procedures. GL were responsible for statistical analysis. DM, OL, WM, AM and DL were involved in drafting and critically revising the manuscript for important intellectual content. All authors read and approved the final manuscript and accept responsibility for the accuracy and integrity of the work.
Acknowledgements
The authors thank the staff of all participating ICUs for their collaboration and dedication during data collection. Special thanks to the Bacteriology and Research Department of the National Institute for Biomedical Research (NIBR) for their technical support and guidance. The authors also extend their gratitude to the following hospitals for their participation: Ngaliema Clinic, Kinshasa Provincial General Referral Hospital, Médecins de Nuit Clinic, Monkole Mother and Child Hospital Center, University Clinics of Kinshasa, Sino-Congolese Friendship Hospital, and Biamba Marie Mutombo Hospital.
Consent for publication
All authors consent to the publication of this manuscript. Individual patient data are anonymized, and no personal identifiers are included.
Availability of data and materials
The datasets used and/or analyzed during the current study are available from the corresponding author on reasonable request.