Introduction
Diabetes Mellitus and cardiovascular disease including Hypertension are among the most prevalent and impactful Non-Communicable Diseases (NCDs) worldwide, contributing substantially to global morbidity, mortality, and health system burden [1]. Globally, an estimated 830 million adults are living with Diabetes and prevalence continues to rise, with projections exceeding 853 million by 2050, while Hypertension remains a leading cause of cardiovascular morbidity and premature death across populations [2,3]. In India, the burden of these chronic conditions has increased markedly over recent decades, with Diabetes and Hypertension affecting an estimated 11.1% and 33% of adult population respectively, reflecting the rapid epidemiologic transition and growing lifestyle-related risk factors in the country [2,4]. Effective management of Diabetes and Hypertension requires long-term pharmacotherapy and lifestyle modification, yet optimal disease control is persistently undermined by poor medication adherence, which in turn is associated with increased complications, hospitalizations, and healthcare costs [5]. While medication adherence is central to chronic disease management, data from geographically distinct settings such as South Andaman remain scarce. The present study, therefore, aimed to assess medication adherence and its sociodemographic and clinical factors associated with it, among adults with Diabetes and/or Hypertension in South Andaman, thereby addressing a critical gap in the Indian evidence base for adherence research.
Methods
Study Design and Setting
A facility-based cross-sectional analytical study design was adopted to asses medication adherence among adults with Diabetes and/or Hypertension. Three health training centres from South Andaman- Rural Health Training Centre at Chouldhari, Urban Health Training Centre at Haddo and Community Health Centre at Bambooflat- affiliated with Department of Community Medicine of Andaman and Nicobar Islands Institute of Medical Sciences (ANIIMS) were selected as study setting.
Study population
Study was conducted among adults aged 18 years and above residing in South Andaman who had been diagnosed with Diabetes and/or Hypertension and were currently receiving treatment. Individuals who were critically ill, recently hospitalised (within the past one month), with known psychiatric comorbidities, with severe visual or hearing impairment or cognitive impairment were excluded from the study.
Sample size and Sampling
The sample size was calculated using the formula for estimating the sample size in a cross-sectional study n=z2p(1-p)/d2, assuming a 95% confidence level (z = 1.96), a prevalence of poor medication adherence of 39.5% as reported by Olickal et al. and an absolute precision of 5% [6]. Based on this calculation, the required minimum sample size was 368. The sample size was rounded up to 400 participants to accommodate for non-response. Participants were recruited consecutively for data collection from the three health centres.
Data collection and instrument
The questionnaire consisted of sociodemographic and selected clinical parameters of the participants and Medication Adherence Report Scale (MARS-10). MARS-10 is a validated self-reported questionnaire comprising 10 statements that capture both intentional and unintentional non-adherence behaviors in individuals with chronic illnesses. The tool employs a dichotomous Yes/No response format, generating a total score ranging from 0 to 10, with higher scores indicating better adherence. Participants were classified as adherent if they responded “No” to items 1-6 and 9-10 and “Yes” to items 7-8. In addition to the total score, individual item responses were examined to identify specific adherence barriers, including intentional non-adherence related to concerns such as side effects[7]. A score of >6 in total was considered as good adherence and less than that was taken as poor adherence as per the common criteria[8].
Study procedure
After explaining the purpose of the study, informed consent was obtained from each of the participants and data was collected via interview method. Trained data collectors enquired the questions in the language understandable to the participants and responses were recorded in Epicollect5. The study was completed in three months from the approval of Institutional Ethical Committee of ANIIMS.
Results
The study enrolled 400 participants, of whom 178 (44.5%) were male and 222 (55.5%) were female. The majority of participants were below 60 years of age (68.0%), with a slightly higher proportion of younger participants among females (70.7%) compared to males (64.6%). The mean age of participants was 56.57 (10.80) years with age ranging from 32 to 93 years. In terms of educational attainment, secondary education was the most common among males (43.3%), whereas a considerable proportion of females had no formal education (38.7%). Regarding occupation, most females were unemployed or retired (75.7%), while males were more occupationally diverse, with elementary occupations being the most common (22.5%). The predominant socioeconomic category across both sexes was Upper Lower category (as per modified Kuppuswamy classification), accounting for 49% of the total sample [9]. Hinduism was the most prevalent religion (73.0%), and the majority of participants belonged to the General category (77.3%). Nuclear families were the most common household type (52.2%), and most participants were married (88.8%), with widowhood being more frequent among males (79.1% of all widowed participants). Nearly all participants were native island residents (94.3%), with a slightly higher proportion of non-native residents among males (8.4%) than females (3.6%). The details of sociodemographic composition of the study sample is shown in Table I.
Among the 400 participants, 121 had Diabetes, 172 had Hypertension, and 107 had both the diseases. Table II describes the selected clinical parameters that were assessed. Participants indicated a considerable duration of chronic illness, with the average duration from diagnosis being similar for Diabetes (6.62 years) and Hypertension (6.66 years), suggesting prolonged exposure to both disorders. People with Diabetes took an average of 1.64 (0.73) drugs, while people with Hypertension took an average of 2.22 (1.50) medications. This suggests that managing Hypertension is relatively more complicated than managing Diabetes in this setting. Among the participants 262 were taking more than one drug (polytherapy) while the rest 138 were on a single medication. According to the Asian system of BMI classification, most of the people who took part (56%) are in the Obese group [10]. Participants reported an average sleep duration of 6.59 (1.34) hours per day, marginally below the recommended minimum of 7 hours [11].
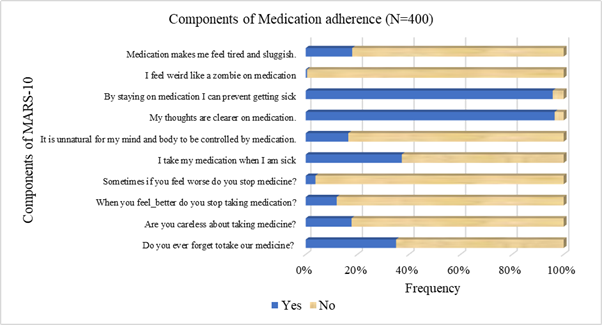
The mean medication adherence score was 7.74 (1.42). The majority of participants demonstrated good adherence (score>5), with 357 individuals (89.3%) classified as adherent, while 43 participants (10.8%) were categorized as having poor adherence. Item-wise analysis of the MARS-10 components (as shown in Figure 1) indicated generally favourable adherence behaviour among participants. While 35.0% (140/400) reported occasionally forgetting to take their medication, substantially fewer participants admitted to being careless (17.8%) or stopping medication when feeling better (12.0%) or worse (3.8%). Nearly two-fifths (37.3%) reported taking medication only when sick. Negative perceptions regarding medication were relatively uncommon: 16.5% felt it was unnatural to be controlled by medication, 18.0% reported feeling tired or sluggish, and 0.5% reported feeling “like a zombie” on medication. In contrast, strong positive beliefs about medication were observed, with 96.5% agreeing that their thoughts are clearer on medication and 95.8% reporting that staying on medication prevents illness. Overall, the item-level distribution suggests predominantly positive beliefs toward medication and relatively low levels of intentional or attitudinal non-adherence.
Bivariate analysis did not demonstrate any statistically significant association between medication adherence and the examined sociodemographic or clinical variables as depicted in Table III and Table IV respectively. Good adherence was observed across both age groups (<60 years: 90.1% vs ≥60 years: 87.5%; p=0.438) and between males (88.2%) and females (90.1%; p=0.545). Similarly, adherence did not significantly differ across socioeconomic categories (p=0.800) or educational levels (p=0.775). Current occupational status (p=0.325), religion (p=0.145), caste (p=0.492), type of family (p=0.679), marital status (p=0.348), and residence status (p=0.492) were also not significantly associated with medication adherence. Therefore, medication adherence scores did not significantly differ across age groups, gender, educational status, or socioeconomic categories.
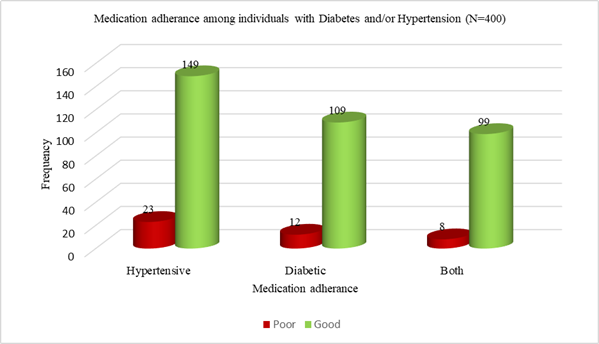
Figure 2 illustrates the distribution of medication adherence across disease categories. Among participants with Hypertension alone, 86.6% demonstrated high adherence and 23 (13.4%) had low adherence. Similarly, among individuals with Diabetes alone, 109 (90.1%) showed high adherence while 12 (9.9%) were poorly adherent. Among those with both Diabetes and Hypertension, 99 (92.5%) exhibited high adherence and 8 (7.5%) had low adherence. Overall, high adherence was consistently observed across all disease categories. As depicted in Table IV, adherence did not vary significantly by the clinical factors such as disease category (Diabetes, Hypertension, or both; p=0.284), number of medicines taken (monotherapy or polytherapy, p=0.462), BMI classification (p=0.418), or adequacy of sleep duration (p=0.122). There was no statistically significant difference in the duration since diagnosis of Hypertension (Mann-Whitney U = 4586, p = 0.790) or Diabetes (Mann-Whitney U = 2054, p = 0.958) between participants with good and poor medication adherence. Overall, medication adherence appeared to be uniformly distributed across sociodemographic and clinical strata in the study population and not independently associated with adherence levels.
| Sociodemographic factors | Male n (%) | Female n (%) | Frequency (%) | |
| Age in years | Less than 60 | 115 (42.3) | 157 (57.7) | 272 (100) |
| More than 60 | 63 (49.2) | 65 (50.8) | 128 (100) | |
| Education | No formal education | 44 (33.8) | 86 (66.2) | 130 (100) |
| Primary education | 27 (40.3) | 40 (59.7) | 67 (100) | |
| Secondary education | 77 (52.0) | 71 (48.0) | 148 (100) | |
| Higher education | 30 (54.5) | 25 (45.5) | 55 (100) | |
| Occupation | Elementary occupation | 40 (71.4) | 16 (28.6) | 56 (100) |
| Plant and machine operators and assemblers | 10 (83.3) | 2 (16.7) | 12 (100) | |
| Craft and related trade workers | 11 (64.7) | 6 (35.3) | 17 (100) | |
| Skilled agricultural and fishery workers | 11 (91.7) | 1 (8.3) | 12 (100) | |
| Skilled workers and shop and market sales workers | 30 (76.9) | 9 (23.1) | 39 (100) | |
| Clerks | 12 (57.1) | 9 (42.9) | 21 (100) | |
| Technicians and associate professionals | 4 (50.0) | 4 (50.0) | 8 (100) | |
| Professionals | 5 (41.7) | 7 (58.3) | 12 (100) | |
| Unemployed/ retired | 55 (24.7) | 168 (75.3) | 223 (100) | |
| Socioeconomic status | Upper | 19 (54.3) | 16 (45.7) | 35 (100) |
| Upper Middle | 28 (54.9) | 23 (45.1) | 51 (100) | |
| Lower Middle | 34 (54.8) | 28 (45.2) | 62 (100) | |
| Upper Lower | 82 (41.8) | 114 (58.1) | 196 (100) | |
| Lower | 15 (26.8) | 41 (73.2) | 56 (100) | |
| Religion | Hindu | 135 (46.2) | 157 (53.8) | 292 (100) |
| Muslim | 32 (41.6) | 45 (58.4) | 77 (100) | |
| Christian | 11 (35.5) | 20 (64.5) | 31 (100) | |
| Caste | General | 140 (45.3) | 169 (54.7) | 309 (100) |
| Others | 38 (41.8) | 53 (58.2) | 91 (100) | |
| Type of family | Nuclear | 104 (49.8) | 105 (50.2) | 209 (100) |
| Joint | 60 (38.0) | 98 (62.0) | 158 (100) | |
| Extended | 14 (42.4) | 19 (57.6) | 33 (100) | |
| Marital status | Married | 169 (47.6) | 186 (52.4) | 355 (100) |
| Unmarried | 0 (0) | 2 (100.0) | 2 (100) | |
| Widowed | 34 (79.1) | 9 (20.9) | 43 (100) | |
| Resident status | Native island resident | 163 (43.2) | 214 (56.8) | 377 (100) |
| Non-native resident | 15 (65.2) | 8 (34.8) | 23 (100) |
| Clinical parameters | Mean (Standard Deviation) | |
| Duration since diagnosis (in years) | Diabetes | 6.62 (5.98) |
| Hypertension | 6.66 (5.83) | |
| Number of medicines taken | Diabetes | 1.64 (0.73) |
| Hypertension | 2.22 (1.50) | |
| Body Mass Index(Asian classification) | Diabetes | 25.54 (3.76) |
| Hypertension | 25.54 (3.76) | |
| Number of hours of sleep | Diabetes | 6.59 (1.34) |
| Hypertension | 6.59 (1.34) |
| Sociodemographic factors | Medication Adherence f (%) | Chi-square/ Fischer Exact test | P value | ||
| Good | Poor | ||||
| Age | Less than 60 years | 245 (90.1) | 27 (9.9) | 0.601 | 0.438 |
| More than 60 years | 112 (87.5) | 16 (12.5) | |||
| Gender | Male | 157 (88.2) | 21 (11.8) | 0.367 | 0.545 |
| Female | 200 (90.1) | 22 (9.9) | |||
| Socioeconomic status | Upper | 32 (91.4) | 3 (8.6) | 0.445 | 0.800 |
| Middle | 102 (90.3) | 11 (9.7) | |||
| Lower | 223 (88.5) | 29 (11.5) | |||
| Education | No formal education | 116 (89.2) | 14 (10.8) | 1.109 | 0.775 |
| Primary education | 61 (91.0) | 6 (9.0) | |||
| Secondary education | 133 (89.9) | 15 (10.1) | |||
| Higher education | 47 (85.5) | 8 (14.5) | |||
| Current occupational status | Not working | 196 (87.9) | 27 (12.1) | 0.968 | 0.325 |
| Working | 161 (87.9) | 16 (9.0) | |||
| Religion | Hindu | 260 (89.0) | 32 (11.0) | 3.860 | 0.145 |
| Muslim | 72 (93.5) | 5 (6.5) | |||
| Christian | 25 (80.6) | 6 (19.4) | |||
| Caste | General | 274 (88.7) | 35 (11.3) | 0.471 | 0.492 |
| Others | 83 (91.2) | 8 (8.8) | |||
| Type of family | Nuclear | 188 (90.0) | 21 (10.0) | 0.774 | 0.679 |
| Joint | 141 (89.2) | 17 (10.8) | |||
| Extended | 28 (84.8) | 5 (15.2) | |||
| Marital status | Married | 315 (88.7) | 40 (11.3) | 0.881 | 0.348 |
| Others | 42 (93.3) | 3 (6.7) | |||
| Residence | Islander | 335 (88.9) | 42 (11.1) | *1.994 | 0.492 |
| Mainland India | 22 (95.7) | 1 (4.3) |
| Clinical factors | Medication Adherence f (%) | Chi-square/ Fischer Exact test | P value | ||
| Good | Poor | ||||
| Chronic diseases | Diabetes | 109 (90.1) | 12 (9.9) | 2.515 | 0.284 |
| Hypertension | 149 (86.6) | 23 (13.4) | |||
| Both | 99 (92.5) | 8 (7.5) | |||
| Number of medicines taken | Monotherapy | 236 (90.1) | 26 (9.9) | 0.540 | 0.462 |
| Polytherapy | 121 (87.7) | 17 (12.3) | |||
| BMI | Normal | 78 (90.7) | 8 (9.3) | 2.832 | 0.418 |
| Underweight | 9 (75.0) | 3 (25.0) | |||
| Overweight | 69 (88.5) | 9 (11.5) | |||
| Obese | 201 (89.7) | 23 (10.3) | |||
| Number of hours of sleep | Adequate | 202 (91.4) | 19 (8.6) | 2.385 | 0.122 |
| Inadequate | 155 (86.6) | 24 (13.4) |
Discussion
The present study assessed medication adherence among adults with Diabetes and/or Hypertension in South Andaman using the MARS-10 scale and explored its association with sociodemographic and clinical characteristics. The mean adherence score was 7.74 (1.42), and nearly nine out of ten participants (89.3%) demonstrated good adherence. Importantly, medication adherence did not show statistically significant associations with age, gender, education, socioeconomic status, religion, caste, marital status, residence status, occupational status, disease category, BMI, duration of illness, number of medications, or sleep duration. These findings suggest that adherence behavior in this population is relatively homogeneous and not strongly patterned by conventional sociodemographic or clinical determinants.
The proportion of good medication adherence observed in the present study (89.3%) is substantially higher than that reported in many mainland Indian and international studies [12]. A study from Cameroon documented a non-adherence prevalence of 54.4% (95% CI: 47.1–61.5%) and identified older age, alcohol consumption, and insulin-only therapy as independent predictors of non-adherence [13]. Among hypertensive populations, lower adherence levels have also been reported; a study from Saudi Arabia found that only 36.3% of participants demonstrated high adherence, while 63.7% had low or moderate adherence, and a study from Nepal reported a prevalence of high adherence of 61% [14,15]. Despite geographical constraints and potential access barriers, the findings may indicate strong health-seeking behaviour and adherence to medical advice among island residents, possibly driven by a desire to preserve functional independence and prevent NCD-related complications.
High medication adherence could also be attributed to contextual factors unique to South Andaman including relatively smaller and stable population structure and better continuity of care in a geographically bounded setting. The item-wise analysis of MARS-10 further supports this observation. The majority of participants endorsed positive beliefs regarding medication use, with over 95% agreeing that staying on medication prevents illness and that their thoughts are clearer while on medication. Intentional non-adherence behaviors such as stopping medication when feeling better (12.0%) or worse (3.8%) were relatively uncommon. This pattern suggests that non-adherence in this setting may be driven more by unintentional factors (e.g., forgetfulness reported by 35%) rather than negative beliefs about medication. Additionally, the high proportion of married individuals (88.8%) and predominance of nuclear or joint family structures may contribute to consistent social support across groups, attenuating variability in adherence behavior.
The study did not find significant associations between adherence and disease type (Diabetes, Hypertension, or both), duration of illness, number of medications, BMI, or sleep duration. This is particularly important, as polypharmacy and longer disease duration are often linked with poorer adherence in chronic disease populations [16]. The relatively low pill burden (1.64 for Diabetes and 2.22 for Hypertension) may partly explain the sustained adherence levels. Furthermore, the absence of association between duration of illness and adherence (as assessed by Mann-–Whitney U test) suggests that treatment fatigue may not be a major concern in this setting.
The use of the MARS-10, a validated and widely used tool, ensured standardized and reliable measurement of medication adherence across participants. A robust sample size for a geographically isolated setting like South Andaman and the facility-based recruitment ensured that all participants were confirmed diagnosed cases actively receiving treatment, adding clinical relevance to the findings. Notably, this study addresses a significant evidence gap, being the first to examine medication adherence in this underrepresented region.
Nonetheless, certain methodological considerations warrant caution while interpreting the findings. The cross-sectional design limits any causal interpretation and does not allow for assessment of adherence patterns over time. The facility-based approach may not fully capture individuals managing these conditions outside the formal healthcare system, potentially skewing adherence estimates upward. Self-reported data, while practical, carries the inherent risk of social desirability bias, and consecutive sampling may restrict the broader generalizability of the results. Since 35% of participants reported occasionally forgetting medication, simple and low-cost interventions such as medication reminders, structured follow-up calls, SMS reminders, pill organizers or family engagement strategies could meaningfully improve adherence at the facility level. Healthcare providers should routinely screen for unintentional non-adherence rather than assuming that positive medication beliefs translate into consistent behaviour.
Declarations
Ethical Clearance
Ethical clearance for this study was obtained from the Institutional Ethics Committee of Andaman and Nicobar Islands Institute of Medical Sciences, vide reference number ANIIMS/IEC.2025/29, dated 09/03/2025. Written informed consent was obtained from all participants prior to data collection, and confidentiality of participant information was maintained throughout the study.
Conflict of interest declaration
The authors declare no conflict of interest in relation to this study.
Funding/ financial support
This research received no specific funding from any public, commercial, or not-for-profit funding agency. The study was conducted as part of the authors' academic work and was self-funded.
Contributors
The authors acknowledge the contribution of medical officers and staff of the health centres in South Andaman for their administrative support and all participants for their willing participation in the study.
Contribution details
Gayathri Ponath Sukumaran - concept, design, definition of intellectual content, manuscript editing and manuscript review- guarantor
Aanchal Anand - data analysis, manuscript preparation, manuscript editing and manuscript review
Samar Hossain - concept, design, definition of intellectual content, manuscript editing and manuscript review
Ajay Raj Sethuraman - literature search, data acquisition, data analysis, manuscript preparation
Acknowledgements
None